Monday, December 18, 2006
Figure 122: Harlan's Bio Picture
Sunday, December 17, 2006
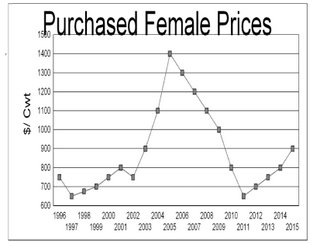
Figure 121: Early 2006 Projected Bred Female Prices

As part of my 2006 drought strategies work, I projected the purchase price of replacement bred females to use in the re-stocking strategies. Remember, these are annual prices. For example, as of Dec 2006 bred replacement heifers are selling in the 1050 to 1200 range but the 2006 annual price is considerably higher.
The key point of this chart is that bred female prices are projected to trend downward the rest of this decade and may even extend a couple of years into the next decade. The one exception might be if a lot of ranchers decide to restock after the 2006 drought all in one year. I doubt that will happen as we will need rain and green grass in all of cow country to trigger a massive re-stocking in one year.
I am often asked about when ranchers should consider buying added heifers. I think it will be towards the end of this decade when weaned heifer calf prices are at the lowest.
Friday, December 01, 2006
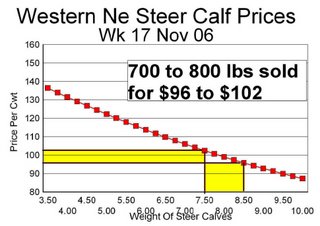
Figure 120: Market Price Lines For Week 17 Nov 06


These two market price lines illustrate the Western Nebraska feeder calf and feeder cattle markets the week of 17 Nov 06. It is clear that the increased corn market has impacted feeder cattle prices more than feeder calf prices. I am suggesting that me might see corn prices now in the $3.00 per bushel area compared to the $2.00 or lower era of past few years.
Family Living Draw For North Dakota Famers & Ranchers

Farm Business Management Data for North Dakota clearly indicates Family Living Draw is increasing for farmers and ranchers. This chart suggests that Family Living Draw is increasing $1500 per year. This is equal to the typical net cash income generated from 15 beef cows. This, then, suggests that ranchers need to add 15 cows per year just to cover the added family living draw!

