Saturday, January 15, 2005
Economic Efficiency Of 2004 IRM Herds
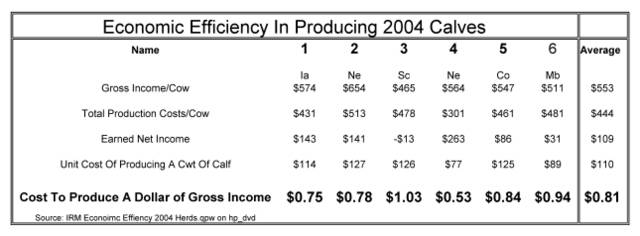
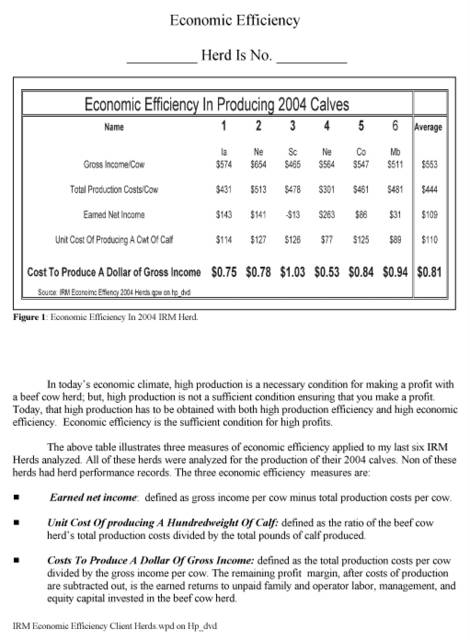
In today's economic climate, high production is a necessary condition for making a profit with a beef cow herd; but, high production is not a sufficient condition ensuring that you make a profit. Economic efficiency is the sufficient condition for high profits. Today, that high production has to be obtained with both high production efficiency and high economic efficiency.
The above table illustrates three measures of economic efficiency applied to my last six IRM Herds analyzed. All of these herds were analyzed for the production of their 2004 calves. Non of these herds had herd performance records.
The three economic efficiency measures are:
Earned net income: defined as gross income per cow minus total production costs per cow.
Unit Cost Of producing A Hundredweight Of Calf: defined as the ratio of the beef cow herds total production costs divided by the total pounds of calf produced.
Costs To Produce A Dollar Of Gross Income: defined as the total production costs per cow divided by the gross income per cow. The remaining profit margin, after costs of production are subtracted out, is the earned returns to unpaid family and operator labor, management, and equity capital invested in the beef cow herd.
Production Efficiency Of 2004 IRM Herds
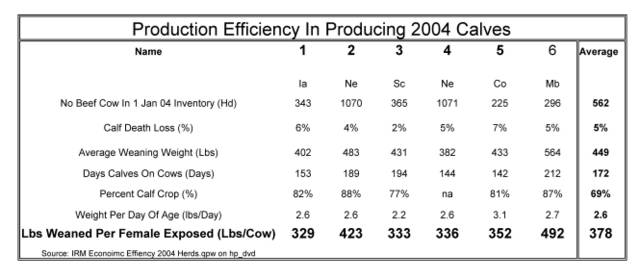
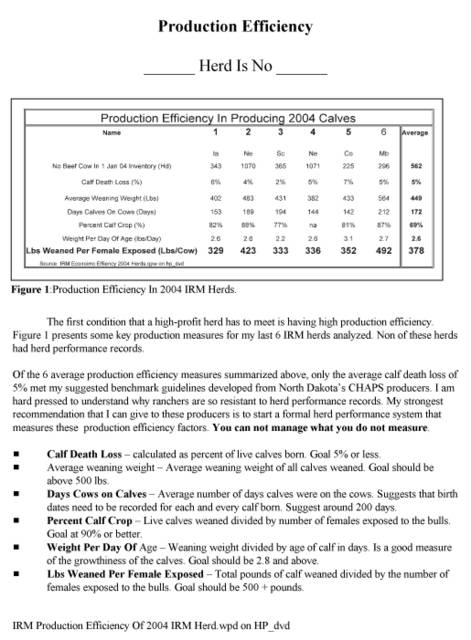
The first condition that a high-profit herd has to meet is having high production efficiency. Figure 1 presents some key production measures for my last 6 IRM herds analyzed. Non of these herds had herd performance records.
Of the 6 average production efficiency measures summarized above, only the average calf death loss of 5% met my suggested benchmark guidelines developed from North Dakota's CHAPS producers. I am hard pressed to understand why ranchers are so resistant to herd performance records. My strongest recommendation that I can give to these producers is to start a formal herd performance system that measures these production efficiency factors. You can not manage what you do not measure.
Calf Death Loss : calculated as percent of live calves born. Goal 5% or less.
Average weaning weight: Average weaning weight of all calves weaned. Goal should be above 500 lbs.
Days Cows on Calves: Average number of days calves were on the cows. Suggests that birth dates need to be recorded for each and every calf born. Suggest around 200 days.
Percent Calf Crop: Live calves weaned divided by number of females exposed to the bulls. Goal at 90% or better.
Weight Per Day Of Age: Weaning weight divided by age of calf in days. Is a good measure of the growthiness of the calves. Goal should be 2.8 and above.
Lbs Weaned Per Female Exposed: Total pounds of calf weaned divided by the number of females exposed to the bulls. Goal should be 500 + pounds.
IRM Economic Benchmarks For 2004
One of the most powerful management tools available to ranchers is the benchmarking his herd's Economic Facts against the average Economic Facts of a set of benchmark herds. This table presents my last six IRM Cost & Return Analyses and the benchmark averages for these six herds. None of these herds had Herd Performance Records.
When you benchmark your herd, you first look for your herd's strengths designated by those Economic Facts where your herd beats the average of the benchmark herds.
Second, you look for those Economic Facts where your herd is beat by the average of the benchmark herds. This, then, identifies some weaknesses in your herd's production and these become your bottleneck(s) to profits. Your management goal is to remove these bottlenecks one at a time. As each bottleneck is removed, your herd's profit goes up.
Then, next year we conduct another IRM Cost & Return Analysis of your herd, and again benchmark your herd against a set of new benchmarks always looking for bottlenecks to profitability. Once again, as one or more bottlenecks are removed, profit again goes up.
This is an annual and continuos process.
IRM Production Benchmarks for 2004
One of the most powerful management tools available to ranchers is the benchmarking his herd's production facts against the average production facts of a set of benchmark herds. This table presents my last six IRM Cost & Return Analyses and the benchmark averages for these six herds. None of these herds had Herd Performance Records.
When you benchmark your herd, you first look for your herd's strengths designated by those Production Facts where your herd beats the average of the benchmark herds.
Second, you look for those Production Facts where your herd is beat by the average of the benchmark herds. This, then, identifies some weaknesses in your herd's production and these become your bottleneck(s) to profits. Your management goal is to remove these bottlenecks one at a time. As each bottleneck is removed, your herd's profit goes up.
Then, next year we conduct another IRM Cost & Return Analysis of your herd, and again benchmark your herd against the rest always looking for bottlenecks to profitability. Once again, one or more bottlenecks are removed and profit again goes up.
![]()
